Microsoft Excel
The dbt Semantic Layer offers a seamless integration with Excel Online and Desktop through a custom menu. This add-on allows you to build dbt Semantic Layer queries and return data on your metrics directly within Excel.
Prerequisites
- You have configured the dbt Semantic Layer and are using dbt v1.6 or higher.
- You need a Microsoft Excel account with access to install add-ons.
- You have a dbt Cloud Environment ID and a service token to authenticate with from a dbt Cloud account.
- You must have a dbt Cloud Team or Enterprise account. Suitable for both Multi-tenant and Single-tenant deployment.
- Single-tenant accounts should contact their account representative for necessary setup and enablement.
📹 Learn about the dbt Semantic Layer with on-demand video courses!
Explore our dbt Semantic Layer on-demand course to learn how to define and query metrics in your dbt project.
Additionally, dive into mini-courses for querying the dbt Semantic Layer in your favorite tools: Tableau, Hex, and Mode.
Installing the add-on
The dbt Semantic Layer Microsoft Excel integration is available to download directly on Microsoft AppSource. You can choose to download this add-on in for both Excel Desktop and Excel Online
-
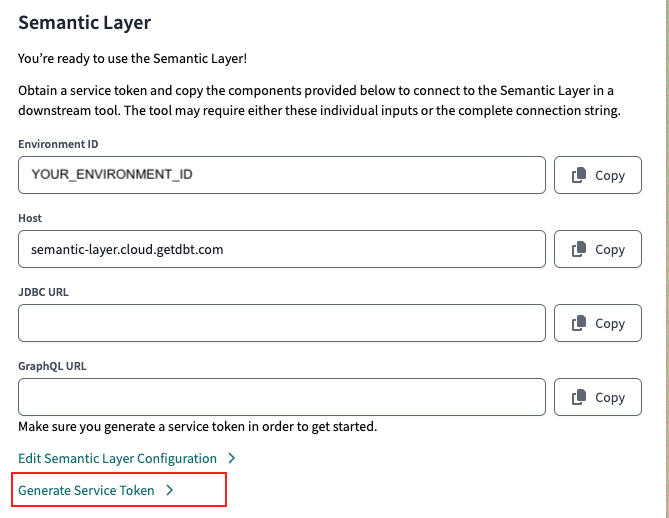
In Excel, authenticate with your host, dbt Cloud environment ID, and service token.
- Access your Environment ID, Host, and URLs in your dbt Cloud Semantic Layer settings. Generate a service token in the Semantic Layer settings or API tokens settings
-
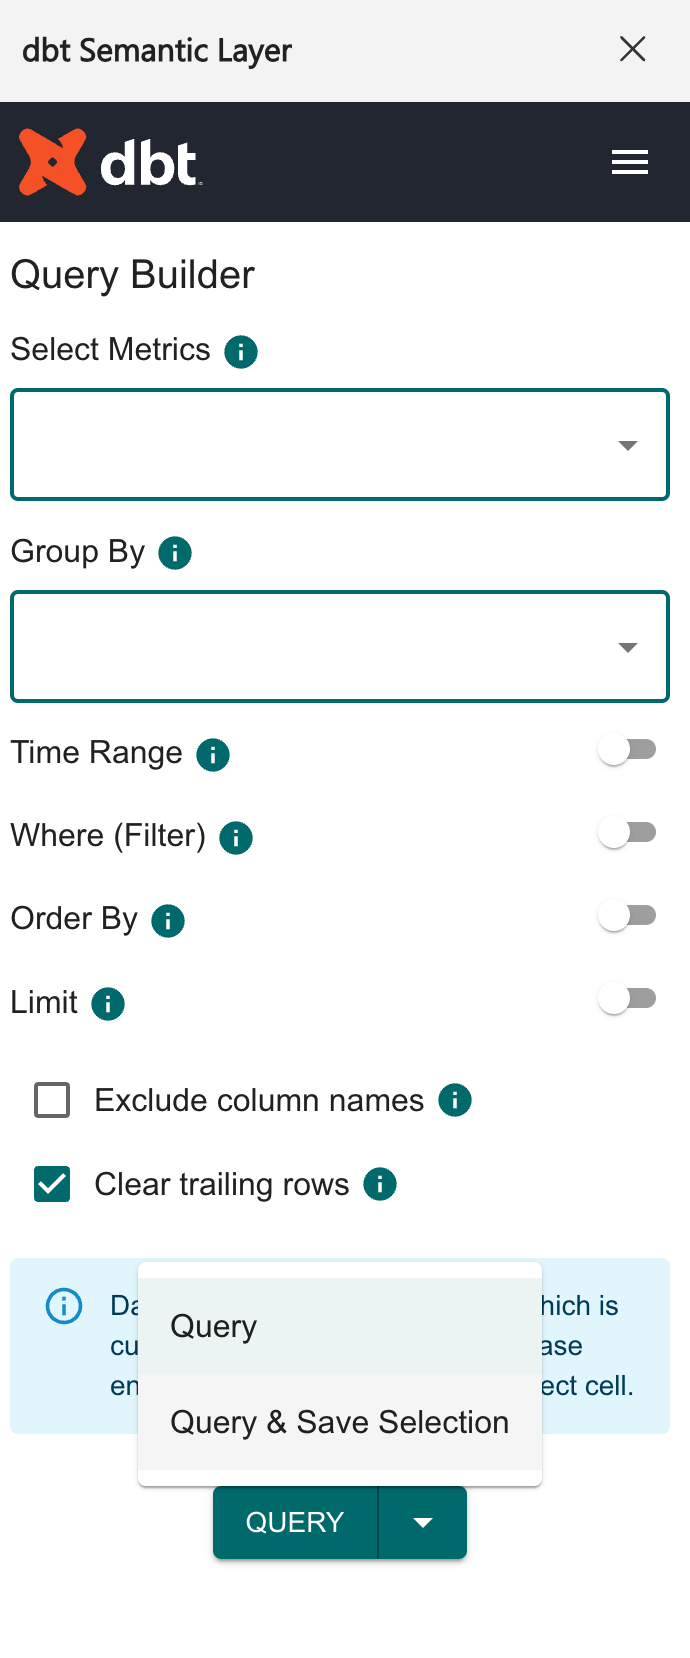
Start querying your metrics using the Query Builder. For more info on the menu functions, refer to Query Builder functions. To cancel a query while running, press the Cancel button.
When querying your data with Microsoft Excel:
- It returns the data to the cell you clicked on.
- There's a timeout of 1 minute for queries.
- If you're using this extension, make sure you're signed into Microsoft with the same Excel profile you used to set up the Add-In. Log in with one profile at a time as using multiple profiles at once might cause issues.
Query Builder functions
The Microsoft Excel Query Builder custom menu has the following capabilities:
| Menu items | Description |
|---|---|
| Metrics | Search and select metrics. |
| Group By | Search and select dimensions or entities to group by. Dimensions are grouped by the entity of the semantic model they come from. You may choose dimensions on their own without metrics. |
| Time Range | Quickly select time ranges to look at the data, which applies to the main time series for the metrics (metric time), or do more advanced filter using the "Custom" selection. |
| Where | Filter your data. This includes categorical and time filters. |
| Order By | Return your data order. |
| Limit | Set a limit for the rows of your output. |
Note: Click the info button next to any metric or dimension to see its defined description from your dbt project.
Modifying time granularity
When you select time dimensions in the Group By menu, you'll see a list of available time granularities. The lowest granularity is selected by default. Metric time is the default time dimension for grouping your metrics.
Filtering data
To use the filter functionality, choose the dimension you want to filter by and select the operation you want to filter on.
- For categorical dimensions, you can type a value into search or select from a populated list.
- For entities, you must type the value you are looking for as we do not load all of them given the large number of values.
- Continue adding additional filters as needed with AND and OR.
- For time dimensions, you can use the time range selector to filter on presets or custom options. The time range selector applies only to the primary time dimension (
metric_time). For all other time dimensions that aren'tmetric_time, you can use the "Where" option to apply filters.
Other settings
If you would like to just query the data values without the headers, you can optionally select the Exclude column names box.
To return your results and keep any previously selected data below it intact, un-select the Clear trailing rows box. By default, we'll clear all trailing rows if there's stale data.
 Run a query in the Query Builder. Use the arrow next to the Query button to select additional settings.
Using saved selections
Saved selections allow you to save the inputs you've created in the Microsoft Excel Query Builder and easily access them again so you don't have to continuously build common queries from scratch. To create a saved selection:
- Run a query in the Query Builder.
- Save the selection by selecting the arrow next to the Query button and then select Query & Save Selection.
- The application saves these selections, allowing you to view and edit them from the hamburger menu under Saved Selections.
Refreshing selections
Set your saved selections to automatically refresh every time you load the addon. You can do this by selecting Refresh on Load when creating the saved selection. When you access the addon and have saved selections that should refresh, you'll see "Loading..." in the cells that are refreshing.
Public saved selections will refresh for anyone who edits the sheet.
- Saved selections are saved components that you can create only when using the application.
- Saved queries, explained in the next section, are code-defined sections of data you create in your dbt project that you can easily access and use for building selections. You can also use the results from a saved query to create a saved selection.
Using saved queries
Access saved queries, powered by MetricFlow, in Microsoft Excel to quickly get results from pre-defined sets of data. To access the saved queries in Microsoft Excel:
- Open the hamburger menu in Microsoft Excel.
- Navigate to Saved Queries to access the ones available to you.
- You can also select Build Selection, which allows you to explore the existing query. This won't change the original query defined in the code.
- If you use a
WHEREfilter in a saved query, Microsoft Excel displays the advanced syntax for this filter.
